
GIS is Old. Time to Start Over.

The current version of GIS can be seen as a 1.0 model—built in an era when computers were in their infancy, and storage and processing power were both limited and prohibitively expensive. It was originally tailored to meet the needs of landscape architects and urban planners. However, since those early days, computing technology has advanced dramatically, and the demands for managing, analyzing, and modeling geospatial data have evolved significantly.
Despite this progress, the foundational design of GIS, still widely in use, has become outdated and no longer meets modern requirements. Our geospatial world is rapidly evolving, shaped by factors such as climate change, digital twins, ecological disruptions, war, natural disasters, human displacement, globalization, and the rise of Artificial Intelligence (AI), location-aware devices and drones. The surge in Earth observation data further highlights the dynamic nature of this landscape.
As I explore the next innovation in geospatial technology, the concept of map layers has captured my attention. While layers are an essential database construct in GIS, their limitations often go unnoticed. In many ways, they hinder our ability to make geospatial data truly integrable and accessible beyond the confines of traditional GIS systems. This article lays out some of those constraints and ideas for how to think outside the map layer.
The era of traditional GIS maps is fading—it's time to create the future of geospatial technology.
The History of GIS for Context
The history of Geographic Information Systems (GIS) offers valuable insights into its limitations and helps shape its future development. In the early days of computing, the emergence of Computer-Aided Design (CAD) systems marked a significant step toward automating the creation of visual designs using lines and points. The first CAD system was introduced in 1957, and one of its key applications was automating the process of map creation. This innovation, known as Automated Mapping, gained popularity across various industries, particularly in utility mapping, where it became known as AM/FM (Automated Mapping/Facilities Management).

In the 1960s, IBM collaborated with Roger Tomlinson to pioneer the development of a Canadian land inventory. This work introduced key concepts such as categorization, feature simplification, and attribution—laying the foundation for modern geographic information systems. Early tools and equipment for digitizing, and scanning were developed to streamline the process of entering map data into the system, revolutionizing how map & geographic data was managed and analyzed.
In 1964, city planner and architect Howard T. Fisher developed SYMAP, one of the earliest computer mapping software programs. Following this groundbreaking innovation, Fisher founded the Laboratory for Computer Graphics and Spatial Analysis at the Harvard Graduate School of Design. This lab became a cornerstone in the evolution of modern GIS technology, including ArcGIS. Notably, Jack Dangermond, the founder of ESRI, and Scott Morehouse, ArcGIS's first lead developer, studied at this institution. The origins of GIS are deeply rooted in urban planning and landscape architecture, fields in which Dangermond holds both of his academic degrees.
The Graphic Overlay Method
The publishing of Ian McHarg's book "Design with Nature" in 1969 greatly influenced Dangermond and defined the graphic overlay method as noted on ESRI's History of GIS webpage "Ian McHarg’s influential book champions a holistic, environmentally conscious approach to landscape architecture and urban planning. He introduces the “layer cake” method of stacking information that becomes fundamental to modern map overlays in GIS." Today's GIS was designed to implement McHarg's method and is still used today.
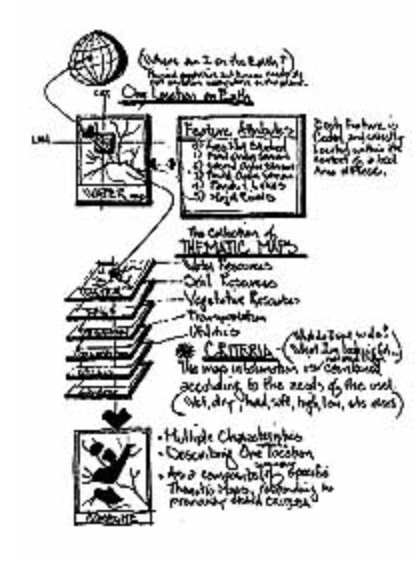
The influence of both CAD, IBM, McHarg and Harvard's early contributions to GIS helps us understand the layer-based design central to these systems. For instance, landscape architects (LAs) traditionally used mylar sheets to trace specific map features such as vegetation, water bodies, or topographic lines. These layers were then overlaid on a light table to analyze overlaps and determine suitable placements for elements like water features, trees, or parks. They used their eyes and measurement tools to see patterns and relationships. GIS emerged as a tool to automate this process, streamlining the analysis and decision-making. Meanwhile, CAD was also evolving, using layered maps to replicate accurate symbology and combine various graphic elements, further advancing map creation and design workflows.
By the late 1980s, CAD and GIS were vying for dominance in the map automation industry. GIS brought unique advantages, such as the ability to work with attributes, overlays, buffers, and traces, all made possible through its use of topology and integration with databases. On the other hand, CAD excelled in offering user-friendly tools, faster drafting capabilities, and a readily available, trained workforce. At the time, engineering firms produced maps and drawings while maintaining strong relationships with government agencies, utilities, and other stakeholders. Although GIS offered greater functionality, it faced significant challenges: it was complex to use, lacked a skilled workforce, and had no established applications to support its adoption.
Are Layers an effective construct in modern database design?
GIS eventually became the go-to tool for most mapping and analytical tasks, but the foundational concept of layers was never critically re-evaluated. Layers are effective for tasks like suitability analysis and map creation, as they simplify and categorize geographic data into disciplines-specific groupings. This simplification was historically necessary to reduce computational costs and ensure algorithms functioned efficiently. However, GIS was not built to handle large, complex datasets. Layers struggle to accommodate data that evolves over time, objects with intricate relationships with other geographic features, or exhibits complexity that varies across different scales.
Geospatial from a Geographic Perspective
Since its inception, the evolution of GIS has often felt like forcing a square peg into a round hole. Over the years, the layer-based model has been stretched and modified to accommodate everything from long transaction editing to the intricate modeling of interconnected ecosystems. Yet, as computing power grows, cloud resources expand, and database technologies advance, the limitations of a map- and layer-centric GIS have become increasingly evident.
Connectedness, rather than classifications, is more vital to scientific thinking today than ever before.
The time has come to reimagine GIS—shifting towards a truly geographic-centric information system, one that fully embraces modern technology. It might go by a different name, and some may see it as un-special, but I believe it has the potential to revolutionize how we approach data modeling. This transformation, however, presents a profound challenge: how do we accurately model the complexity of our world? How can we capture the intricate dynamics of an electrical grid, a forest or a hurricane forming for example or an entire ecosystem in real time, enabling humanity to coexist harmoniously with the very processes that sustain life? In many ways, it will drive us to understand, design and build better systems as we uncover the beauty of natural systems. It is bigger than a map, layer or app. It is fundamental to driving a better future for humanity.
It’s a bold vision, but one worth pursuing.
How do we achieve this? We must move beyond the current GIS paradigm and shift our focus away from traditional maps. Instead, we need to embrace advanced concepts like tensors, spatial embeddings, ML/AI, blockchain, quantum computing, and physics to truly integrate time and space. Space cannot exist without time—time itself is a consequence of space. As I have written previously, connecting these dimensions represents the next major challenge and is critical for the evolution of technology.