What is a map?
Merriam-Webster defines it as “a representation usually on a flat surface of the whole or a part of an area”
What a map is by definition vague. As we rapidly move into an instrumented world, maps will play an ever-increasingly important role. This post attempts to begin a conversation about maps and mapping and how little most people [including technologists] understand about maps.
Maps represent a view of reality. They represent an abstraction of a place. For natural features which change constantly, they show approximate locations relative to other features. For example a stream and bridge. For man-made features, even surveyed locations change as the earth moves via earthquakes or other natural disasters.
Maps are not current. Elements on a map possess varying degrees of currency, with some dating back decades while others remain recent additions.
Maps show human-made boundaries. Certain elements on a map are not concrete representations. Examples include state boundaries, property lines, time zones, districts, and zip codes. These features symbolize abstract concepts that can be visually represented on a map.
Maps show non-existent features. As we strive to deconstruct nature, we often impose artificial boundaries that do not naturally exist. These boundaries, such as soil types, flood zones, wetlands, and forest boundaries, aid us in modeling physical phenomena. However, it is crucial to acknowledge that these boundaries are mere approximations or educated assumptions, often established years or even decades ago.
Maps display estimates. Maps provide a glimpse into a specific moment, relying on limited observations and educated approximations. They portray discrete data points as fluid representations, capturing the dynamic nature of ocean currents, weather patterns, geology, and more.
Maps can be manipulative. Maps, just like any other form of documentation, possess the ability to manipulate reality. As Mark Monmonier eloquently elaborates in his renowned book, "How to Lie with Maps," cartographers possess the power to shape and present information to align with their desired narrative. Particularly in politically charged contexts, maps serve as a tool to portray a specific viewpoint.
Maps before computers
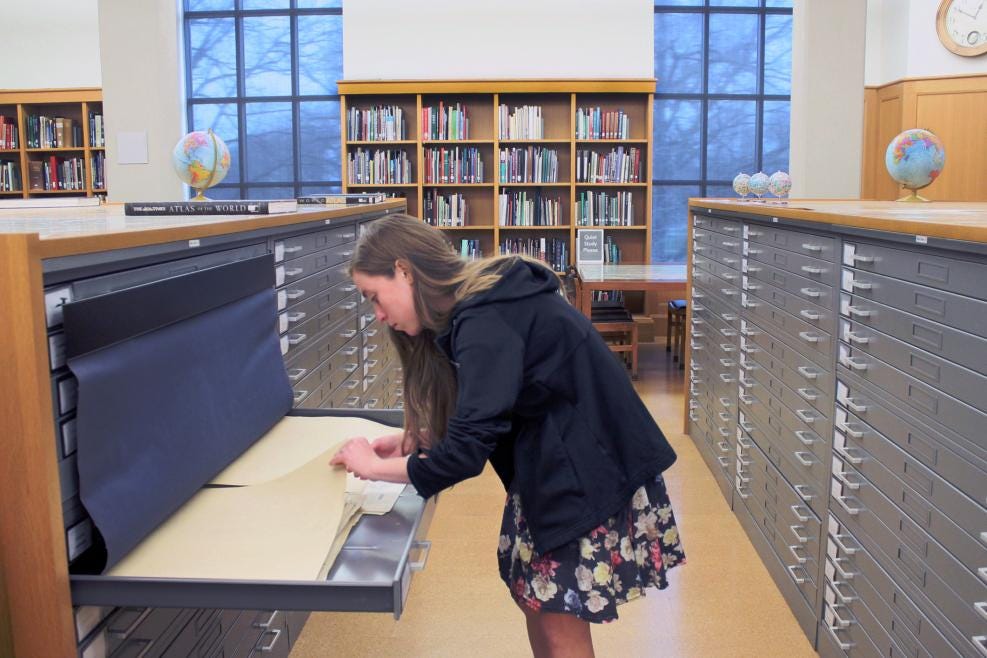
Not too long ago, cartographers - the skilled professionals responsible for crafting maps - relied solely on pen and paper to bring their creations to life. Back in the 1980s, when I took my first cartography class, the concept of using software for map-making was in its infancy. The initial step was to carefully select a suitable base map, considering factors like projection type (equal area versus equal distance). Fortunately, I had the privilege of studying cartography at UCLA, which boasted an exceptional map library.
I vividly remember meticulously tracing the chosen base map onto parchment, employing ink pens, Zipatone, and stencils to add marginalia, north arrows, and legends. Gathering, summarizing, and standardizing the data behind my choropleth map was a laborious process that involved frequent trips to the library, where I transcribed information by hand onto paper. Analyzing the data required the use of a calculator, as I strived to accurately represent changes in the Hispanic population in Orange County, broken down by zip code. This task demanded some ingenuity to effectively convey the information using appropriate class breaks.
Even in today's era of advanced software, a comprehensive understanding of cartographic principles, projections, statistics, and more remains indispensable.
As you can imagine, the foundation map and data source played a crucial role. In my case, it was a simple task [my very first hand-drawn map!]. However, for intricate maps that display vital information, assembling all the necessary data became an arduous process.
If you were creating a map that had never been created, conducting field surveys with specialized equipment was essential. These surveys involved measuring the locations of objects in relation to a designated survey point.
After mapping software
Once automated mapping/GIS became available, tracing basemaps was done using a digitizing board and puck. They still make these devices because not all the world’s data is automated. The task involved identifying the coordinates of at least two points on the physical map to enable proper automation within the correct coordinate system or projection. This often involved a lot of guesswork and estimation.
During my early days as a summer intern at ESRI, my job was to digitize maps. However, the software at that time only had single precision, which meant that the coordinates were not very accurate. Tracing complex map features like rivers, winding roads, and contours was a tedious process that introduced more errors.
This is how many of the maps used today were incorporated into systems like GIS and CAD. Once you digitized adjacent maps, you had to carefully align them to ensure a seamless connection, which introduced further movement to the coordinates. Finally, to establish topology (connectedness), various tools such as BUILD and CLEAN were employed, but this often caused the coordinates to shift even more (fuzzy creep). The ARC/INFO system for creating data was called ARCEDIT.
I digitized various maps during my time, including AAA road maps, Greek Navy bathymetric maps, Boston Gas gas pipes, Hong Kong land information / cadastral maps, Singapore parcel maps, Missouri DOT maps, and National Geographic maps. Each line, point, or polygon was coded with distinct values to allow for easy separation of layers in the GIS. A data dictionary was developed to facilitate this process, tailored to the specific needs of the client's automated layers of information. During my second job at ESRI, I was responsible for building the data dictionary in INFO for a significant Air Force project.
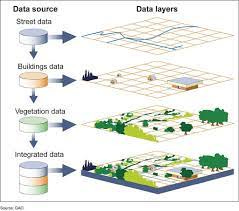
Using the computerized map layers with attributes tied map features with descriptive data stored in relational databases. These automated maps could then be drawn on, plotted, overlaid with other maps, reprojected, and shared. The subsystem in ARC/INFO that provided the tools to do this was called ARCPLOT. Attribute data could be used to derive symbology, create annotations, create classes, and bring in data from other systems. Subsequently, overlays, proximity analysis, tracing, routing, splitting, combining, and other operations could be performed to create derivative data layers and maps.
Why the Map’s Origin is Important
Today, most GIS professionals don’t know where the original map data they are using was derived from. Who did the survey, what tolerances did they use and how accurate was their equipment? What assumptions did they use and did they eyeball locations in areas with no data?
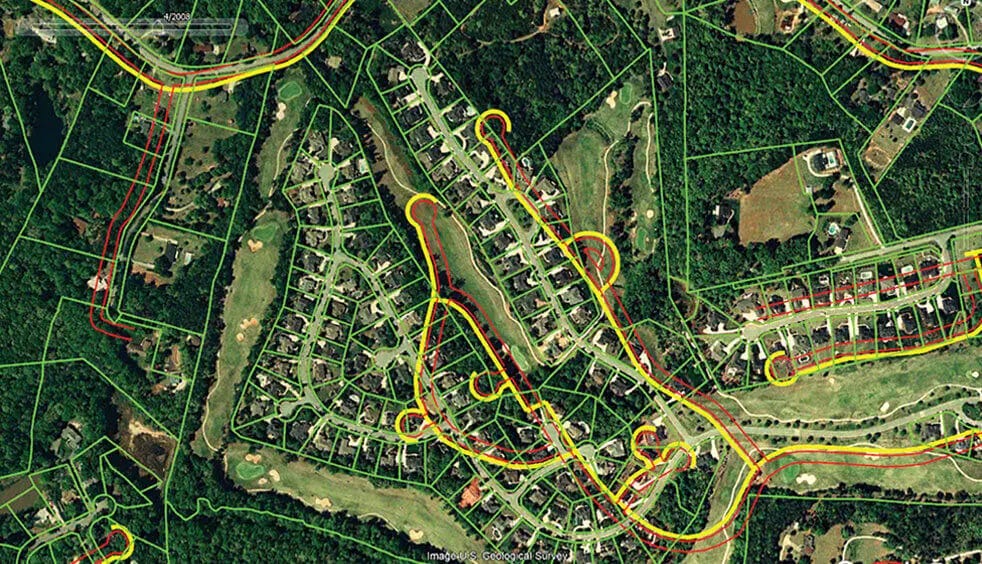
With today’s highly accurate data collection equipment, work is now being done to match the base maps to the GPS, satellite, LIDAR, aerial photogrammetry, and other data sources but many old maps are still being used. Conflation, edge matching, and rubbersheeting are some of the terms that describe this process.
Why is GIS map-centric?
When GIS first emerged, it relied on a command line interface. The focus was on working with data to construct and analyze geospatial information, which was closely linked to attribute information such as parcel details and ownership records. A typical analysis would involve generating a list of addresses located within a 150-foot radius of a store with a pending liquor license application. After ensuring that none of the addresses belonged to schools or daycare centers, letters would be sent to those addresses accordingly.
Certain commands were developed specifically for map creation. Once all the necessary elements such as layers, symbology, and a north arrow were added, the map was printed using a costly plotter. GIS revolutionized the mapping process by automating it.
Nowadays, GIS professionals rely on a map front end to perform similar queries. While this approach may enhance the visual aspect, its actual value remains limited. Making the map the interface for GIS professionals, slowed the work of analysis and limited access to technology professionals who are more interested in the data or the result than the map. It also keeps maps out of reach for the non-professional.
Using a GIS-centric approach, “web maps” brought map visualization to the internet and in many ways, made maps a new user interface (UI). This aspect of maps needs modernization. Using a map to access information easily, collaborate with stakeholders, and organize information is different than sharing your GIS project.
Maps
Maps are complex. They have deep histories, they tell stories, and take a position. Maps are a powerful way to help us understand complex topics. While maps can and are used for negative consequences, they also help us make sense of complex information. They integrate disparate data using geography. They provide insights that words, tables, and diagrams cannot provide.
A Modern Map
Let’s start over with maps.
Technology opened up new frontiers for maps that we have yet to explore. Can we liberate maps from the past? Pioneering technology developed by CAD, GIS, and driving direction apps paved the way. Imagine if maps, as a freely accessible document type, were available to all. It could unlock new horizons and possibilities. As maps become an integral part of society’s interface to the world, broader understanding and worlds open up. Instead of dividing us, maps bring us together as we see our connectedness.
New technologies such as IoT, AI, edge computing, blockchain, Web3, and quantum computing enable a new mapping paradigm.
When you ask a geospatial question using AI, it should display the answer as a map. What will those maps look like?
How will future maps communicate rapidly changing conditions from instruments steaming live data from millions of sensors?
Does visualization of “a representation usually on a flat surface of the whole or a part of an area” need to be points, lines, and polygons? Are there better ways to show a living, breathing Earth?
If you could have a conversation with a map, what kind of questions would you ask? Here are a few examples:
Which routes should I take for evacuating from my house in case of an emergency?
What are the crime patterns for my community where are the best locations for community actions?
Show me the best places to grocery shop right now based on traffic and parking availability.
Where do whales migrate during the winter months along the California coast?
Where do the materials for my smartphone come from?
What is the current resilience level for my city and how can I help?
How can utilizing a map facilitate collaboration with individuals who share a common interest? Consider the following possibilities:
Identify optimal locations for logging activities that minimize downstream pollution by collaborating via a map with community groups, environmentalists, and timber companies.
Stay informed about proposed redevelopment plans and contribute your ideas.
Plan your vacation with friends on a map.
View and share data you found while searching on a topic you are interested in on a map.
Create a community map showing available resources during an emergency.
Can we increase the accuracy of maps via crowdsourcing?
Engage citizens to collect accurate location information about assets with their phones and drones.
Enable community connections through location.
Maps provide a valuable interface to many activities. Maps are as powerful a document type as spreadsheets or presentations
Let’s unleash maps from the dusty map room and old, complex technology!


